DevOps Bag-of-Tricks
Table of Contents
Every blog post I've tried to write in the last year has started from a simple idea and gradually expanded in scope until I'm left with a sprawling epic that I know no one will ever read and I will never bring myself to publish. So here's something different. This isn't so much a blog post as a wiki entry. I'm allowing myself to edit it at any time, which alleviates some of my publishing-related anxiety.
Here are my notes to myself on how to play sysadmin in a cloud environment.
1 Inspecting a machine
Sometimes you'll SSH in to an unfamiliar environment and need to get the lay of the land quickly in order to start debugging. We'll start with a 1000-foot view before zooming in.
1.1 Who else is here?
Whenever I get paged because of an anomalous resource usage pattern on
a box (e.g., the disk is nearly full, CPU or memory usage are spiking,
etc.), the first thing I do is use w to check for humans doing silly
things.
w
 07:05:33 up 1 day, 5 min,  3 users,  load average: 0.16, 0.28, 0.52
USER     TTY      FROM             LOGIN@   IDLE   JCPU   PCPU WHAT
astahlma tty7     :0               Mon07   24:04m  2:15   0.28s /usr/bin/lxsession -s LXDE -e LXDE
astahlma pts/2    tmux(3208).%0    Mon07   22:43m  1:13   2.80s -zsh
astahlma pts/5    tmux(3208).%1    Mon08   22.00s  0.72s  0.72s -zsh
Thankfully I'm all by my lonesome here on my laptop.
1.2 Which are the most expensive processes?
top is the most popular tool for getting a high-level overview of
system resource consumption for each process. But if you have sysadmin
access on the machine then you should install htop, which is like
top's attractive and more capable cousin.
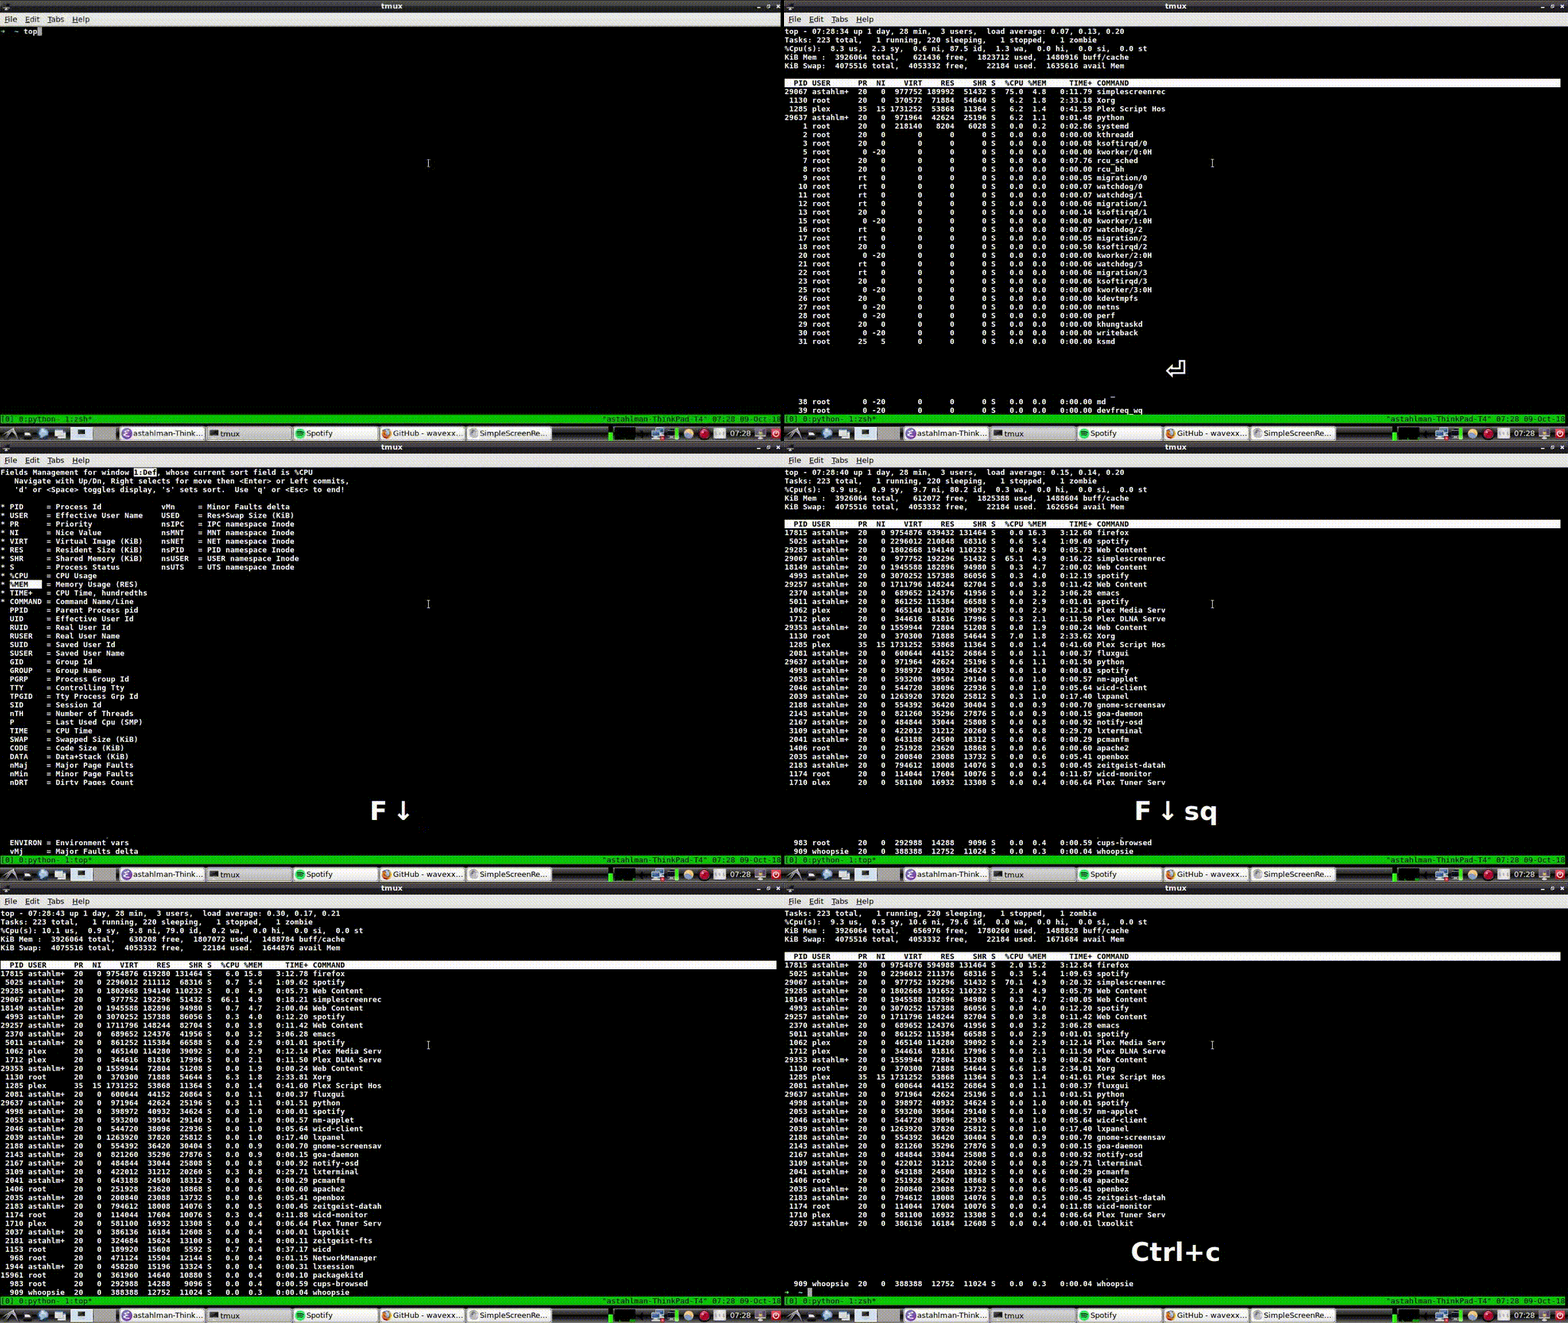
Here's top (running on my laptop):

I know that I can select which resource to sort by, only because I bothered to read the man page. But that's about as fancy as top gets.
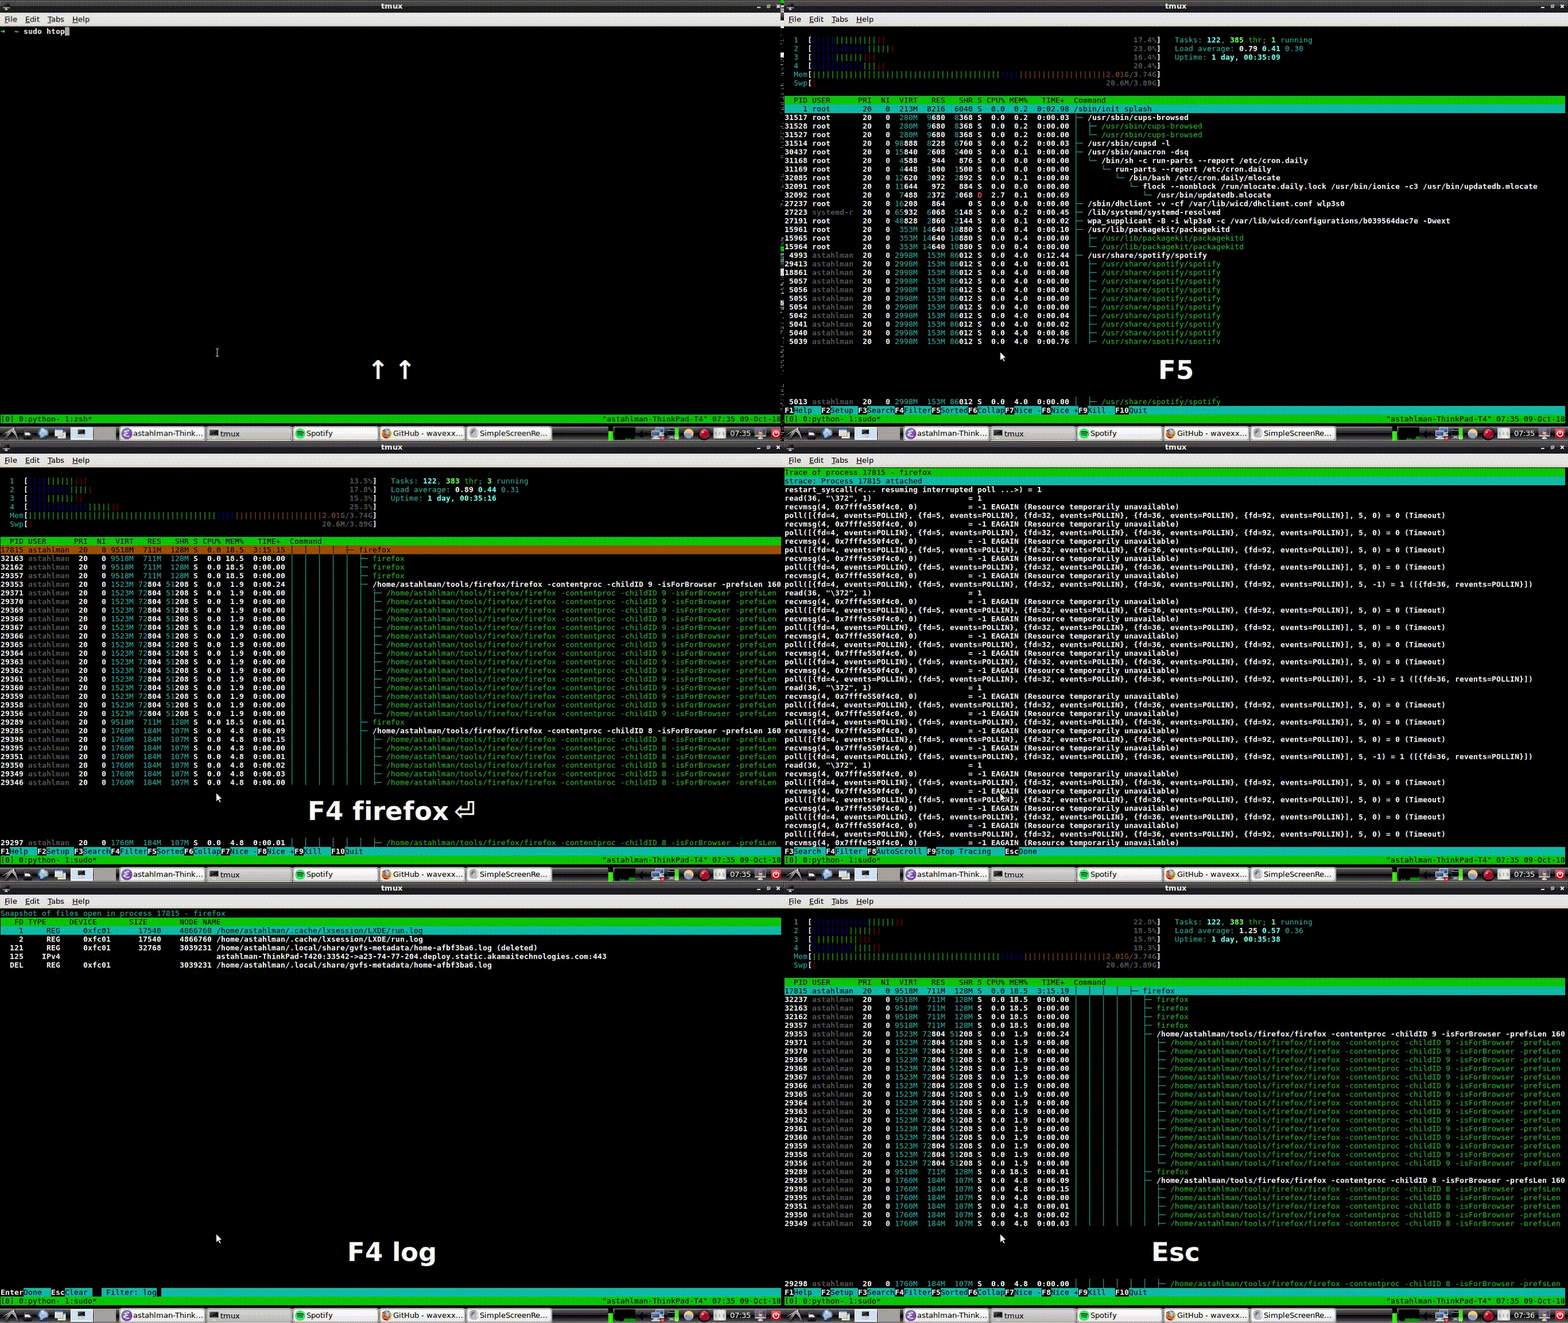
In contrast, here's htop. I have never consulted the man page for htop, because I've never felt the need to. The UI is intuitive and holds your hand every step of the way by giving you a menu of available keys. It even has a built-in help section.

In case that's hard to follow, here's a quick breakdown of everything happening in that .gif:
- The initial view is a flat view of processes sorted by CPU usage, which is the default. Notice that the memory usage, swap usage, and the load on each CPU is charted in the top-left corner.
- I press <F5>, which switches the display from a flat list of processes sorted by resource usage to a tree view, which displays the full process tree rooted at PID 1.
- I press <F4> to filter, then start typing "firefox" to incrementally filter the process tree. I'm left with only firefox and all of its descendants.
- I press the "s" key to begin tracing system calls for the firefox
process with
strace(more on that below). - I escape the strace session and press the "l" key to view all of
firefox's open file handles with
lsof(more on that later, too). - I press <F4> to filter the list of file handles owned by the firefox process, then start typing "log" to match only files whose name contains that string.
Amazing, huh?
I get it, breaking up is hard to do. But don't cry over the good times you and top had together - smile because they happened, and then move on with htop.
2 Inspecting individual processes
Now you've narrowed your focus to a specific process. Here are a few techniques to see how it interacts with its environment.
2.1 Where are the logs for this process?
I've got Spotify running on my laptop. Let's see if it does any logging…
ps -f --ppid 1 | grep "Spotify.app"
501 684 1 0 1:30PM ?? 1:22.77 /Applications/Spotify.app/Contents/MacOS/Spotify -psn_0_73746 | | | | | | | | | | | | | | | |
export PID=684
If the process is writing to a log file then it must have a file handle open for writing.
lsof -p $PID | grep -i log
| Spotify 684 andrewstahlman 88w REG 1 | 5 187 8598375040 /Users/andrewstahlman/Library/Caches/com.spotify.client/Browser/Local Storage/leveldb/LOG |
| Spotify 684 andrewstahlman 91w REG 1 | 5 56441 8598347694 /Users/andrewstahlman/Library/Caches/com.spotify.client/Browser/Local Storage/leveldb/000539.log |
| Spotify 684 andrewstahlman 94w REG 1 | 5 297 8598375070 /Users/andrewstahlman/Library/Caches/com.spotify.client/Browser/LOG |
| Spotify 684 andrewstahlman 99w REG 1 | 5 0 8594628670 /Users/andrewstahlman/Library/Caches/com.spotify.client/Browser/000003.log |
Let's examine only regular files opened in write-mode.
lsof -p $PID | perl -lane '$F[3] =~ m/[0-9]+w/ && print'
| Spotify 684 andrewstahlman 88w REG 1 | 5 187 8598375040 /Users/andrewstahlman/Library/Caches/com.spotify.client/Browser/Local Storage/leveldb/LOG |
| Spotify 684 andrewstahlman 90w REG 1 | 5 44698 8590792313 /Users/andrewstahlman/Library/Caches/com.spotify.client/Browser/Local Storage/leveldb/MANIFEST-000001 |
| Spotify 684 andrewstahlman 91w REG 1 | 5 56441 8598347694 /Users/andrewstahlman/Library/Caches/com.spotify.client/Browser/Local Storage/leveldb/000539.log |
| Spotify 684 andrewstahlman 94w REG 1 | 5 297 8598375070 /Users/andrewstahlman/Library/Caches/com.spotify.client/Browser/LOG |
| Spotify 684 andrewstahlman 98w REG 1 | 5 41 8594628668 /Users/andrewstahlman/Library/Caches/com.spotify.client/Browser/MANIFEST-000001 |
| Spotify 684 andrewstahlman 99w REG 1 | 5 0 8594628670 /Users/andrewstahlman/Library/Caches/com.spotify.client/Browser/000003.log |
| Spotify 684 andrewstahlman 123w REG 1 | 5 1472 8598375664 /Users/andrewstahlman/Library/Saved Application State/com.spotify.client.savedState/windows.plist |
Yep, those are log files. Let's check out those leveldb logs. Side note: leveldb is a library implementation of a kv-store. It looks like Spotify is using it to store some data locally on disk. Here's some ad-targeting configuration it's keeping on me:
cat "~/Library/Caches/com.spotify.client/Browser/Local Storage/leveldb/000544.log" | \
LC_ALL=C sed 's/\\n/\
/g' | perl -lne 'print if /var ad/ .. /}/'
var adMetadata = {
        ...
        targetingParams: {
          'country': 'us',
          'historicgenre': 'classical',
          'gender': 'male',
          ...
          'abtest': 'ads-preroll-mvto-ss_Control,ad-sponsored-playlist-dw_Control,premium_18q3_audio_assertive_android_cta_test_learn_more_companion,2018q3_premium_quicksilver_student_dualcta_us_Small-CTA,premium_18q1_evergreen_showcase_frequency_month_long_Control,premium_18q1_banner_creative_refresh_test_banner_control,premium_18q3_dynamicupsell_webcopytest_landing-page,ad_exp_5tile_3,adgen_employee_testing_Control,2018q3_premium_personalization_quicksilver_test,premium_18q3_quicksilver_survey_holdout_treatment,2018q3_premium_quicksilver_hulumm_IOprice_us_IO-CO,premium_17q3_ads_creative_refresh_Control,ads_programmatic_banner_exposed,premium_18q3_quicksilver_falcon3_experiment1_Control,2018q3_premium_latam_winback_treatment,iam_marquee_holdout_1percent_Marquee,premium_18q1_audio_creative_quantity_test_audio_holdout,Holiday_2017_Treatment,2018q1_premiumbusiness_dual_offer_US_dual_subject_dual_body,ad-sponsored-playlist-dw2_test,ad-logic-faux-real_Control,ad-logic-skipton-model-test_modified-window,premium_18q2_summer_holdouts_email_upsell_showcase_quicksilver_filler_guaranteed_perf,premium_18q3_quicksilver_asiaprepaid_holdout_Control,ads-video-events-container_Enabled,premium_18q2_evergreen_showcase_creative_variation_Control,premium_18q4_quicksilver_jp_upsell_holdout_treatment,ads_p_video_exposed,premium_18q2_showcase_artist_marketing_holdout_test_Artist-imagery,ads_adserver_alpha_test_Control,ad_mvt_prog_all,premium_18q1_audio_creative_refresh_test_2_New_Character,adserver-first_test,dummy_ss_test_Exposed,ad-betamax-video_On',
          'streamtimebetweenadbreaks': '810',
          'upsellproduct': 'premium',
          'lang': 'en',
          'client_version': 'desktop_1.0.90',
          'age_pr': '26',
          'product': 'premium',
          ...
        }
Looks like I'm in the control group for the "premium_18q1_evergreen_showcase_frequency_month_long" experiment, whatever that is.
2.2 What are its environment variables?
It's sometimes useful to inspect a process' environment variables to
verify that it has been launched with the correct $PATH, secret
keys, log configuration, etc. Environment variables are exposed via
the /proc filesystem on Linux, so you can read the (null-separated)
contents of /proc/$pid/environ like any other text files.
For example, we can inspect the environment variables used by firefox.
cat /proc/$(pidof -s firefox)/environ | tr '\0' '\n' | egrep -v "GDM|GTK|LD_" | head -15
DBUS_SESSION_BUS_ADDRESS=unix:path=/run/user/1000/bus
DEFAULTS_PATH=/usr/share/gconf/LXDE.default.path
DESKTOP_SESSION=LXDE
DISPLAY=:0.0
HOME=/home/astahlman
IM_CONFIG_PHASE=1
LANG=en_US.UTF-8
LANGUAGE=en_US
LOGNAME=astahlman
MANDATORY_PATH=/usr/share/gconf/LXDE.mandatory.path
MESA_GLSL_CACHE_DIR=/tmp/Temp-f946a23f-b9ea-4f12-849e-44da804f4e58
MOZ_ASSUME_USER_NS=1
MOZ_CRASHREPORTER_DATA_DIRECTORY=/home/astahlman/.mozilla/firefox/Crash Reports
MOZ_CRASHREPORTER_EVENTS_DIRECTORY=/home/astahlman/.mozilla/firefox/uibwrxsw.dev-edition-default/crashes/events
MOZ_CRASHREPORTER_PING_DIRECTORY=/home/astahlman/.mozilla/firefox/Pending Pings
Let's filter that down to variables prefixed with "MOZ_"
cat /proc/$(pidof -s firefox)/environ | tr '\0' '\n' | grep "MOZ_"
MOZ_ASSUME_USER_NS=1
MOZ_CRASHREPORTER_DATA_DIRECTORY=/home/astahlman/.mozilla/firefox/Crash Reports
MOZ_CRASHREPORTER_EVENTS_DIRECTORY=/home/astahlman/.mozilla/firefox/uibwrxsw.dev-edition-default/crashes/events
MOZ_CRASHREPORTER_PING_DIRECTORY=/home/astahlman/.mozilla/firefox/Pending Pings
MOZ_CRASHREPORTER_RESTART_ARG_0=/home/astahlman/tools/firefox/firefox
MOZ_CRASHREPORTER_RESTART_ARG_1=
MOZ_CRASHREPORTER_STRINGS_OVERRIDE=/home/astahlman/tools/firefox/browser/crashreporter-override.ini
MOZ_LAUNCHED_CHILD=
MOZ_PROFILER_STARTUP=
MOZ_PROFILER_STARTUP_ENTRIES=
MOZ_PROFILER_STARTUP_FEATURES_BITFIELD=
MOZ_PROFILER_STARTUP_FILTERS=
MOZ_PROFILER_STARTUP_INTERVAL=
MOZ_SANDBOXED=1
MOZ_SANDBOX_USE_CHROOT=1
2.3 Where are its config files located?
If you're able to launch the process, you can put it under a
microscope with strace (or on OSX, dtruss) and trace all of its
system calls.
Let's say you can't remember from where Firefox loads user
settings. You could fire up firefox under strace to record all of
its system calls.
strace firefox 2>&1 | tee /tmp/firefox-syscalls.txt
Give the process a few seconds to initialize, then check the syscalls:
head -n 25 /tmp/firefox-syscalls.txt
execve("/usr/bin/firefox", ["firefox"], [/* 62 vars */]) = 0
brk(NULL)                               = 0x157b000
access("/etc/ld.so.nohwcap", F_OK)      = -1 ENOENT (No such file or directory)
access("/etc/ld.so.preload", R_OK)      = -1 ENOENT (No such file or directory)
openat(AT_FDCWD, "/etc/ld.so.cache", O_RDONLY|O_CLOEXEC) = 3
fstat(3, {st_mode=S_IFREG|0644, st_size=168914, ...}) = 0
mmap(NULL, 168914, PROT_READ, MAP_PRIVATE, 3, 0) = 0x7f6dcdbd7000
close(3)                                = 0
access("/etc/ld.so.nohwcap", F_OK)      = -1 ENOENT (No such file or directory)
openat(AT_FDCWD, "/lib/x86_64-linux-gnu/libpthread.so.0", O_RDONLY|O_CLOEXEC) = 3
\0\1\0\0\0\360a\0\0\0\0\0\0"..., 832) = 832
fstat(3, {st_mode=S_IFREG|0755, st_size=144776, ...}) = 0
mmap(NULL, 8192, PROT_READ|PROT_WRITE, MAP_PRIVATE|MAP_ANONYMOUS, -1, 0) = 0x7f6dcdbd5000
mmap(NULL, 2221160, PROT_READ|PROT_EXEC, MAP_PRIVATE|MAP_DENYWRITE, 3, 0) = 0x7f6dcd7bb000
mprotect(0x7f6dcd7d5000, 2093056, PROT_NONE) = 0
mmap(0x7f6dcd9d4000, 8192, PROT_READ|PROT_WRITE, MAP_PRIVATE|MAP_FIXED|MAP_DENYWRITE, 3, 0x19000) = 0x7f6dcd9d4000
mmap(0x7f6dcd9d6000, 13416, PROT_READ|PROT_WRITE, MAP_PRIVATE|MAP_FIXED|MAP_ANONYMOUS, -1, 0) = 0x7f6dcd9d6000
close(3)                                = 0
access("/etc/ld.so.nohwcap", F_OK)      = -1 ENOENT (No such file or directory)
openat(AT_FDCWD, "/lib/x86_64-linux-gnu/libdl.so.2", O_RDONLY|O_CLOEXEC) = 3
\0\1\0\0\0\220\16\0\0\0\0\0\0"..., 832) = 832
fstat(3, {st_mode=S_IFREG|0644, st_size=14632, ...}) = 0
mmap(NULL, 2109712, PROT_READ|PROT_EXEC, MAP_PRIVATE|MAP_DENYWRITE, 3, 0) = 0x7f6dcd5b7000
mprotect(0x7f6dcd5ba000, 2093056, PROT_NONE) = 0
mmap(0x7f6dcd7b9000, 8192, PROT_READ|PROT_WRITE, MAP_PRIVATE|MAP_FIXED|MAP_DENYWRITE, 3, 0x2000) = 0x7f6dcd7b9000
Let's look at just the calls to open().
perl -lne 'm/openat\(\w+, "([^\"]+)\"/ && print $1' /tmp/firefox-syscalls.txt | head
/etc/ld.so.cache
/lib/x86_64-linux-gnu/libpthread.so.0
/lib/x86_64-linux-gnu/libdl.so.2
/lib/x86_64-linux-gnu/librt.so.1
/usr/lib/x86_64-linux-gnu/libstdc++.so.6
/lib/x86_64-linux-gnu/libm.so.6
/lib/x86_64-linux-gnu/libgcc_s.so.1
/lib/x86_64-linux-gnu/libc.so.6
/home/astahlman/tools/firefox/dependentlibs.list
/home/astahlman/tools/firefox/libnspr4.so
Looks like a lot of shared object files. Let's also print the file type.
perl -lne 'm/openat\(\w+, "([^\"]+)\"/ && print $1' /tmp/firefox-syscalls.txt | xargs -I % file "%" | head
/etc/ld.so.cache: data
/lib/x86_64-linux-gnu/libpthread.so.0: symbolic link to libpthread-2.26.so
/lib/x86_64-linux-gnu/libdl.so.2: symbolic link to libdl-2.26.so
/lib/x86_64-linux-gnu/librt.so.1: symbolic link to librt-2.26.so
/usr/lib/x86_64-linux-gnu/libstdc++.so.6: symbolic link to libstdc++.so.6.0.24
/lib/x86_64-linux-gnu/libm.so.6: symbolic link to libm-2.26.so
/lib/x86_64-linux-gnu/libgcc_s.so.1: ELF 64-bit LSB shared object, x86-64, version 1 (SYSV), dynamically linked, BuildID[sha1]=69c6e15d63392ac94eed3af9166a3e66384c52a7, stripped
/lib/x86_64-linux-gnu/libc.so.6: symbolic link to libc-2.26.so
/home/astahlman/tools/firefox/dependentlibs.list: ASCII text
/home/astahlman/tools/firefox/libnspr4.so: ELF 64-bit LSB shared object, x86-64, version 1 (SYSV), dynamically linked, BuildID[sha1]=f8bf41d87291d74413d28f3f60be2da46300afab, stripped
xargs: file: terminated by signal 13
Let's exclude all of those shared object files…
perl -lne 'm/openat\(\w+, "([^\"]+)\"/ && print $1' /tmp/firefox-syscalls.txt | egrep -v "\.so(\.[0-9])?" | xargs -I % file "%" | head
/home/astahlman/tools/firefox/dependentlibs.list: ASCII text
/proc/filesystems: empty
/home/astahlman/.mozilla/firefox/Crash Reports/InstallTime20181001155545: ASCII text, with no line terminators
/home/astahlman/.mozilla/firefox/Crash Reports/LastCrash: ASCII text, with no line terminators
/home/astahlman/.Xauthority: data
/usr/share/X11/locale/locale.alias: UTF-8 Unicode text
/usr/share/X11/locale/locale.alias: UTF-8 Unicode text
/usr/share/X11/locale/locale.dir: ASCII text
/usr/share/X11/locale/en_US.UTF-8/XLC_LOCALE: ASCII text
/home/astahlman/.Xdefaults-astahlman-ThinkPad-T420: cannot open `/home/astahlman/.Xdefaults-astahlman-ThinkPad-T420' (No such file or directory)
xargs: file: terminated by signal 13
And excluding X11 configuration…
perl -lne 'm/openat\(\w+, "([^\"]+)\"/ && print $1' /tmp/firefox-syscalls.txt | egrep -v "\.so(\.[0-9])?|/X11/" | xargs -I % file "%" | head
/home/astahlman/tools/firefox/dependentlibs.list: ASCII text
/proc/filesystems: empty
/home/astahlman/.mozilla/firefox/Crash Reports/InstallTime20181001155545: ASCII text, with no line terminators
/home/astahlman/.mozilla/firefox/Crash Reports/LastCrash: ASCII text, with no line terminators
/home/astahlman/.Xauthority: data
/home/astahlman/.Xdefaults-astahlman-ThinkPad-T420: cannot open `/home/astahlman/.Xdefaults-astahlman-ThinkPad-T420' (No such file or directory)
/tmp/firefox_astahlman/.parentlock: cannot open `/tmp/firefox_astahlman/.parentlock' (No such file or directory)
/home/astahlman/.Xauthority: data
/home/astahlman/tools/firefox/updates/0/update.version: cannot open `/home/astahlman/tools/firefox/updates/0/update.version' (No such file or directory)
/home/astahlman/.mozilla/firefox/profiles.ini: ASCII text
xargs: file: terminated by signal 13
Hey, profiles.ini sounds promising! And sure enough, that is the
entry point to all of my user-specfic configuration.
cat /home/astahlman/.mozilla/firefox/profiles.ini
[General]
StartWithLastProfile=1

[Profile0]
Name=default
IsRelative=1
Path=XXXXXX.default

[Profile1]
Name=dev-edition-default
IsRelative=1
Path=XXXXXX.dev-edition-default
Default=1
2.4 Who is it talking to?
sudo lsof -i | hgrep firefox
COMMAND     PID            USER   FD   TYPE DEVICE SIZE/OFF NODE NAME
firefox   17815       astahlman   57u  IPv4 154278      0t0  TCP astahlman-ThinkPad-T420:53762->151.101.1.69:https (ESTABLISHED)
firefox   17815       astahlman   59u  IPv4 154285      0t0  TCP astahlman-ThinkPad-T420:42880->sea30s02-in-f10.1e100.net:https (ESTABLISHED)
firefox   17815       astahlman   65u  IPv4 153854      0t0  TCP astahlman-ThinkPad-T420:36226->a23-32-46-65.deploy.static.akamaitechnologies.com:http (ESTABLISHED)
firefox   17815       astahlman   98u  IPv4 155339      0t0  TCP astahlman-ThinkPad-T420:52250->104.16.31.34:https (ESTABLISHED)
firefox   17815       astahlman  105u  IPv4 156457      0t0  TCP astahlman-ThinkPad-T420:44490->sea30s01-in-f10.1e100.net:https (ESTABLISHED)
firefox   17815       astahlman  106u  IPv4 157758      0t0  TCP astahlman-ThinkPad-T420:44612->do-2.lastpass.com:https (ESTABLISHED)
firefox   17815       astahlman  107u  IPv4 153897      0t0  TCP astahlman-ThinkPad-T420:43546->server-52-84-51-200.sea32.r.cloudfront.net:https (ESTABLISHED)
firefox   17815       astahlman  109u  IPv4 155678      0t0  TCP astahlman-ThinkPad-T420:52068->a96-7-85-90.deploy.static.akamaitechnologies.com:https (ESTABLISHED)
firefox   17815       astahlman  119u  IPv4 154828      0t0  TCP astahlman-ThinkPad-T420:54044->ec2-50-112-164-16.us-west-2.compute.amazonaws.com:https (ESTABLISHED)
firefox   17815       astahlman  120u  IPv4 156458      0t0  TCP astahlman-ThinkPad-T420:46576->sea15s12-in-f206.1e100.net:http (ESTABLISHED)
Some of those are recognizable. For instance, 1e100.net is Google. Get it? (It's scientific notation). Lastpass I recognize - don't know why it needs to keep a connection open to home, but good to know that it's using HTTPS, I guess.
What about that first IP address? It's an HTTPS connection, so it should be curlable…
curl https://151.101.1.69
curl: (51) SSL: certificate subject name (*.stackexchange.com) does not match target host name '151.101.1.69'
Ah right, I have a StackOverflow tab open (of course I do). What about that random EC2 instance?
curl https://ec2-50-112-164-16.us-west-2.compute.amazonaws.com
curl: (51) SSL: certificate subject name (push.services.mozilla.com) does not match target host name 'ec2-50-112-164-16.us-west-2.compute.amazonaws.com'
Looks like something that's sending me push notifications from Mozilla. Interesting…
3 Networking
All of the techniques described below were honed by a process consisting of banging my head against the keyboard, sifting through StackExchange answers, and re-reading the AWS docs on EC2 security groups for what felt like the hundredth time.
I am not a networking expert and there are probably smarter ways to do half of this stuff.
Disclaimer done, let's get to it.
3.1 What's my IP address?
List all network interfaces:
ifconfig -l
lo0 gif0 stf0 XHC20 en0 p2p0 awdl0 en1 en2 bridge0 utun0
Find the IP address for a given interface:
ifconfig en0 | grep inet
inet6 fe80::407:3265:b168:386d%en0 prefixlen 64 secured scopeid 0x5
inet 192.168.1.2 netmask 0xffffff00 broadcast 192.168.1.255
3.2 What's the IP address for this hostname?
dig google.com
> DiG 9.10.6 <<>> google.com
;; global options: +cmd
;; Got answer:
>HEADER<<- opcode: QUERY, status: NOERROR, id: 64121
;; flags: qr rd ra; QUERY: 1, ANSWER: 1, AUTHORITY: 0, ADDITIONAL: 1

;; OPT PSEUDOSECTION:
; EDNS: version: 0, flags:; udp: 512
;; QUESTION SECTION:
;google.com.            IN    A

;; ANSWER SECTION:
google.com.        286    IN    A    172.217.3.206

;; Query time: 39 msec
53(192.168.1.1)
;; WHEN: Sun Oct 07 09:44:40 PDT 2018
;; MSG SIZE  rcvd: 55
So "google.com" resolves to 172.217.3.206 - or at least this time it
did. Curiously, google.com does not resolve to a consistent IP
address. Let's repeat the lookup and see what we get back:
for i in {1..25}; do dig +short google.com sleep 1; done | sort | uniq -c
| 9 | 172.217.14.206 |
| 2 | 172.217.3.174 |
| 13 | 172.217.3.206 |
| 1 | 216.58.193.78 |
Interesting - it looks like Google uses round-robin DNS.
3.3 What's the hostname for this IP address?
Using a randomly selected IP address for google.com (see above), let's
use dig with the -x flag to do a reverse DNS lookup.
dig -x 172.217.3.206 +short
sea15s12-in-f14.1e100.net.
sea15s12-in-f206.1e100.net.
sea15s12-in-f14.1e100.net.
sea15s12-in-f206.1e100.net.
Huh. That's interesting. We got back 4 hostnames for that IP address, two of which appear to be duplicates for some reason. As a sanity check, let's do a forward-lookup on those hostnames…
dig +short sea15s12-in-f206.1e100.net
172.217.3.206
dig +short sea15s12-in-f14.1e100.net
172.217.3.206
Yep, same IP, two different hostnames. I'm not sure why Google is doing this, but creating multiple A records that point to the same IP is a totally valid thing to do.
3.4 Can I reach someone at this IP address?
The ping utility comes in handy when you need to debug why one
machine can't connect to another, usually in a cloud-based environment
with some sort of firewall or virtual network. Any time I have two EC2
instances in a VPC that should be talking to each other but aren't, I
use ping to test whether the server is routable from the client.
ping 192.168.1.4
PING 192.168.1.4 (192.168.1.4): 56 data bytes
Request timeout for icmp_seq 0
Request timeout for icmp_seq 1
Request timeout for icmp_seq 2
Request timeout for icmp_seq 3
Request timeout for icmp_seq 4
Request timeout for icmp_seq 5
Request timeout for icmp_seq 6
Request timeout for icmp_seq 7
Request timeout for icmp_seq 8
Request timeout for icmp_seq 9
Request timeout for icmp_seq 10
Request timeout for icmp_seq 11
Request timeout for icmp_seq 12
Request timeout for icmp_seq 13
Request timeout for icmp_seq 14
Request timeout for icmp_seq 15
Request timeout for icmp_seq 16
Request timeout for icmp_seq 17
Request timeout for icmp_seq 18
Request timeout for icmp_seq 19
Request timeout for icmp_seq 20
Request timeout for icmp_seq 21
  C-c C-c
--- 192.168.1.4 ping statistics ---
23 packets transmitted, 0 packets received, 100.0% packet loss
Nope, no one there - or at least, no one there who responds to ping requests.
How about our old friend Google?
ping 172.217.3.206
PING 172.217.3.206 (172.217.3.206): 56 data bytes
64 bytes from 172.217.3.206: icmp_seq=0 ttl=54 time=11.238 ms
64 bytes from 172.217.3.206: icmp_seq=1 ttl=54 time=10.262 ms
64 bytes from 172.217.3.206: icmp_seq=2 ttl=54 time=8.791 ms
64 bytes from 172.217.3.206: icmp_seq=3 ttl=54 time=12.061 ms
64 bytes from 172.217.3.206: icmp_seq=4 ttl=54 time=11.419 ms
64 bytes from 172.217.3.206: icmp_seq=5 ttl=54 time=11.619 ms
64 bytes from 172.217.3.206: icmp_seq=6 ttl=54 time=9.720 ms
64 bytes from 172.217.3.206: icmp_seq=7 ttl=54 time=10.119 ms
64 bytes from 172.217.3.206: icmp_seq=8 ttl=54 time=10.627 ms
64 bytes from 172.217.3.206: icmp_seq=9 ttl=54 time=10.045 ms
64 bytes from 172.217.3.206: icmp_seq=10 ttl=54 time=13.929 ms
64 bytes from 172.217.3.206: icmp_seq=11 ttl=54 time=11.993 ms
64 bytes from 172.217.3.206: icmp_seq=12 ttl=54 time=10.509 ms
64 bytes from 172.217.3.206: icmp_seq=13 ttl=54 time=12.870 ms
64 bytes from 172.217.3.206: icmp_seq=14 ttl=54 time=19.877 ms
64 bytes from 172.217.3.206: icmp_seq=15 ttl=54 time=13.560 ms
64 bytes from 172.217.3.206: icmp_seq=16 ttl=54 time=18.439 ms
  C-c C-c
--- 172.217.3.206 ping statistics ---
17 packets transmitted, 17 packets received, 0.0% packet loss
round-trip min/avg/max/stddev = 8.791/12.181/19.877/2.879 ms
3.5 Is anyone listening on this port?
ping will tell you whether you have a route to a given machine, but
that doesn't always mean that you can connect to process listening on
a specific port. Once I've used ping to confirm that the server I'm
trying to connect to is routable, I use netcat to check whether the
given port is exposed to the client. If it isn't, you usually need to
go update some firewall configuration (in EC2, the problem is usually
your security group settings).
nc -z -w 1 172.217.3.206 80
Connection to 172.217.3.206 port 80 [tcp/http] succeeded!
nc -z -w 1 172.217.3.206 443
Connection to 172.217.3.206 port 443 [tcp/https] succeeded!
nc -z -w 1 172.217.3.206 22 || echo "Failed"
Failed
3.6 SSH tunneling
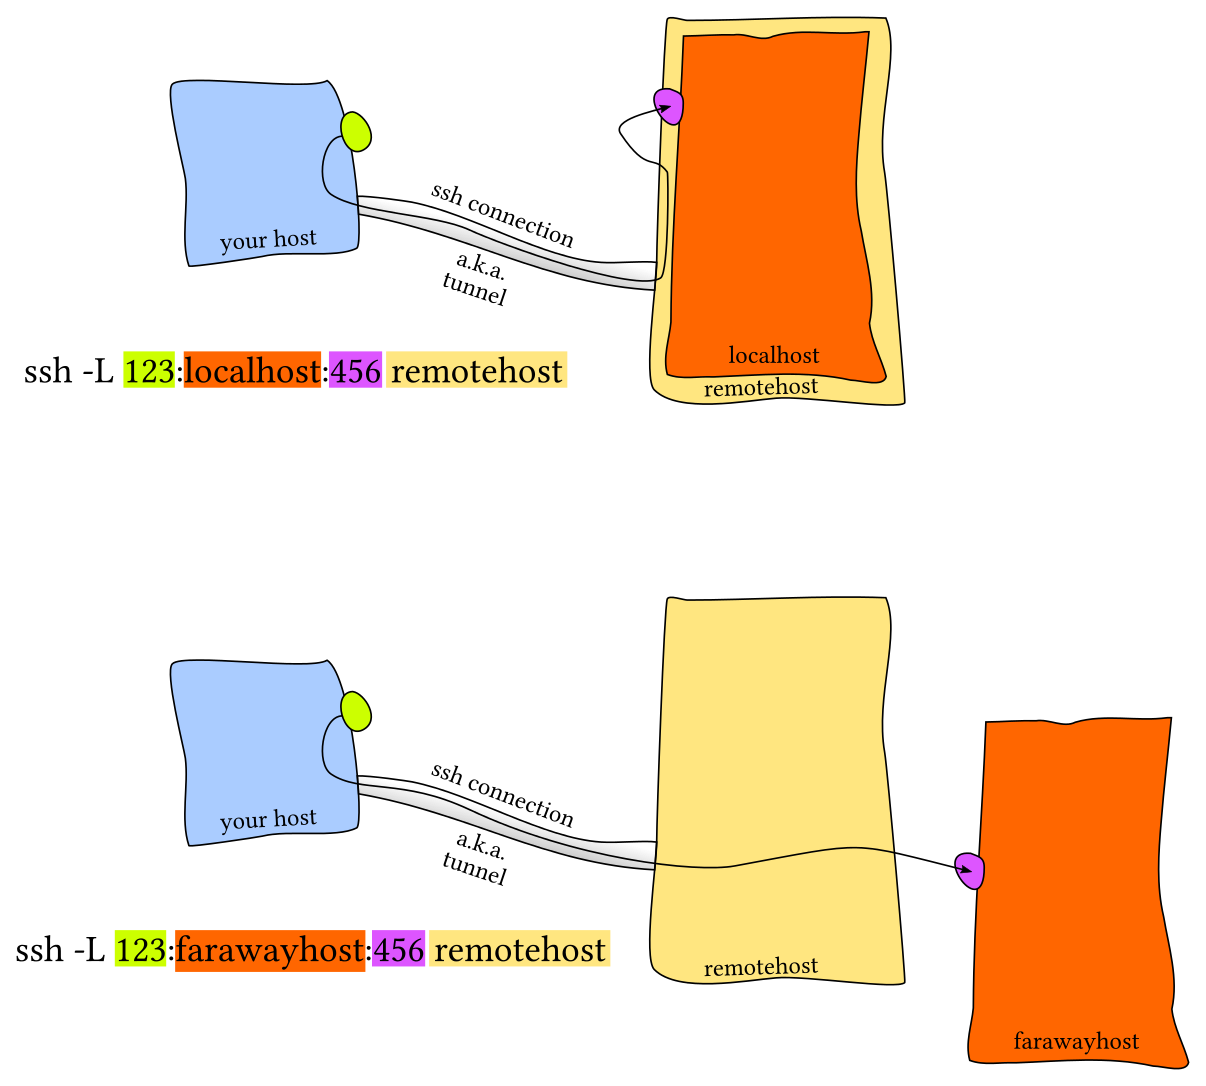
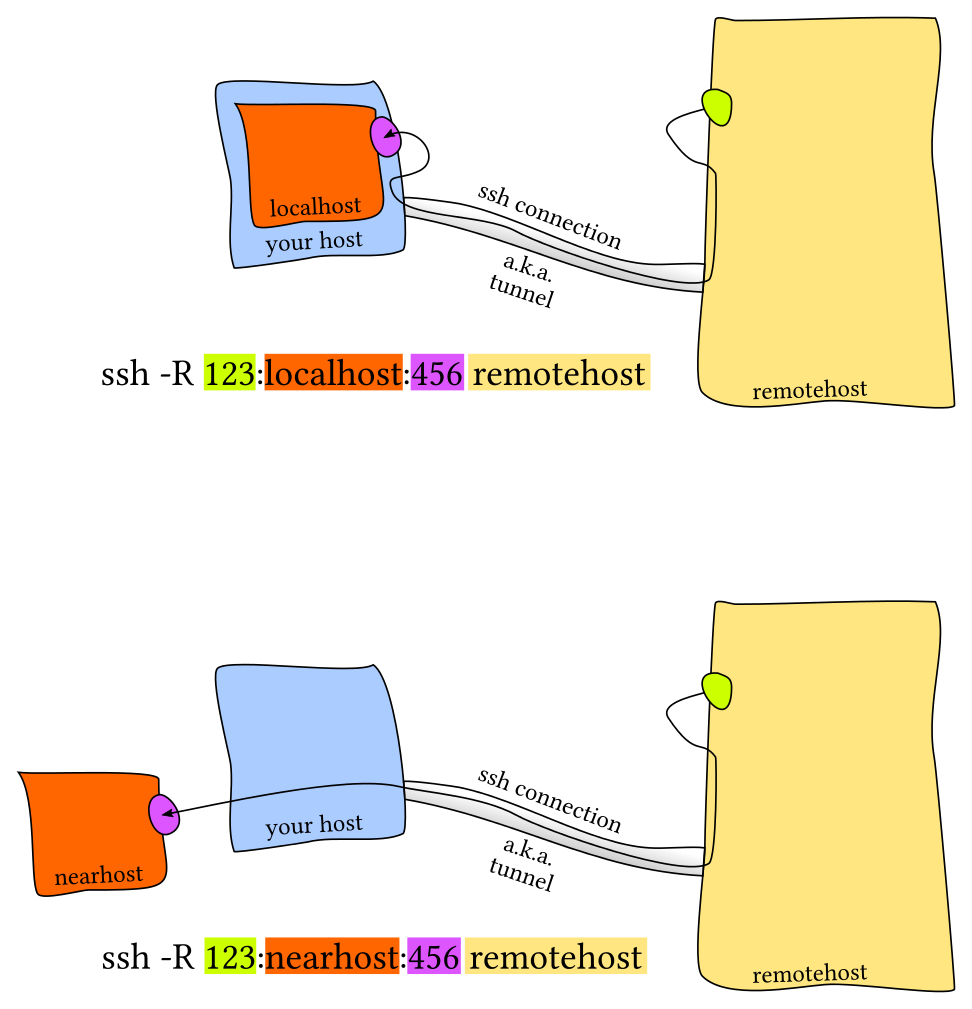
Editorial note: I was considering trying to illustrate the various configurations for SSH tunnels until I came across How does reverse SSH tunneling work? on unix.stackexchange. The answer from user erik has the best pictorial explanation I can imagine, so I'm just going to link to his answer here and include his diagram inline.
SSH tunnels are an invaluable tool to circumvent firewalls. That sounds devious, but there are plenty of legitimate reasons to do this that won't get you fired or trigger an FBI investigation.
3.6.1 Forward tunneling
For example, let's say you've got a Java process running in a staging environment that keeps crashing, and you want to connect your IDE's debugger to the remote JVM's debug port in order to troubleshoot.
Obviously you don't want to expose the debug port to the entire world, so leaving a hole in the firewall for this port is a bad idea. Instead, you can set up an SSH tunnel to securely forward traffic from your laptop to the debug port on the staging machine. The effect is that your Java debugger running on your laptop will connect to an address like localhost:8000, and the SSH daemon will forward the traffic to the debug port on the staging machine.
Another common use-case for (forward) SSH tunnels is connecting to an administrative web UI which is bound to localhost on a remote server. With an SSH tunnel, you can setup an SSH tunnel that forwards localhost:8000 to the appropriate port on localhost of the remote server, fire up your browser, and view the web page from your laptop at localhost:8000.
Forward SSH tunnels look like this:

Notice that there are 3 hosts involved in that second diagram. This type of tunneling is common in environments where SSH access is mediated through a "gateway." I've also heard this referred to as a "bastion" or "jump node." The idea is that only the gateway machine is routable from the outside world, and to log in to a machine on the private network you have to SSH via the gateway.
3.6.2 Reverse tunnel
The diagram above describes regular ol' SSH tunnels, in which a local port forwards to a remote port. But you can also create tunnels that work in the opposite direction, in which a remote port forwards traffic to a local port. I use remote tunnels less frequently, but there are times when they are useful.
Here's a hypothetical (and somewhat contrived) scenario. Let's say you
want to intercept traffic that's intended for some other machine -
maybe you want to see how clients are calling some server. You fire up
netcat on your laptop with nc -l 8000. This just binds a listener to
localhost port 8000 and prints anything it receives on stdout.
Next, you log into the remote machine and shut down the real server
process (to free up its port). Now you can establish a reverse SSH
tunnel from your laptop to the server such that requests to the server
are forwarded "back" to your laptop, like this: ssh -R
8000:localhost:<remote-port> <remote-ip>

4 Appendix: Unix utilities
4.1 hgrep
Like grep, but print the first line unconditionally. This is useful when you are filtering the output of a tabular command and what to preserve the column [h]eaders.
N=0

while read -r line; do
    if [ $N -eq 0 ]; then
        echo "$line"
    else
        echo "$line" | grep $*
    fi
    N=$((N + 1))
done